Socio-demographic and Geographic Disparities in Long-Acting Reversible Contraception Insertion
NEXPLANON® (etonogestrel implant): Selected Safety Information Indication and Warnings and PrecautionsView the data dashboardAbout
The purpose of this dashboard is to provide a tool for public health professionals, policymakers, and researchers to explore the relationship between long-acting reversible contraception (LARC) utilization and various demographic and geographic factors. The dashboard allows users to visualize LARC utilization data at the ZIP3, county and state levels, and to compare LARC utilization. The dashboard also allows users to explore the relationship between LARC utilization and various demographic and geographic factors.
How to use the map
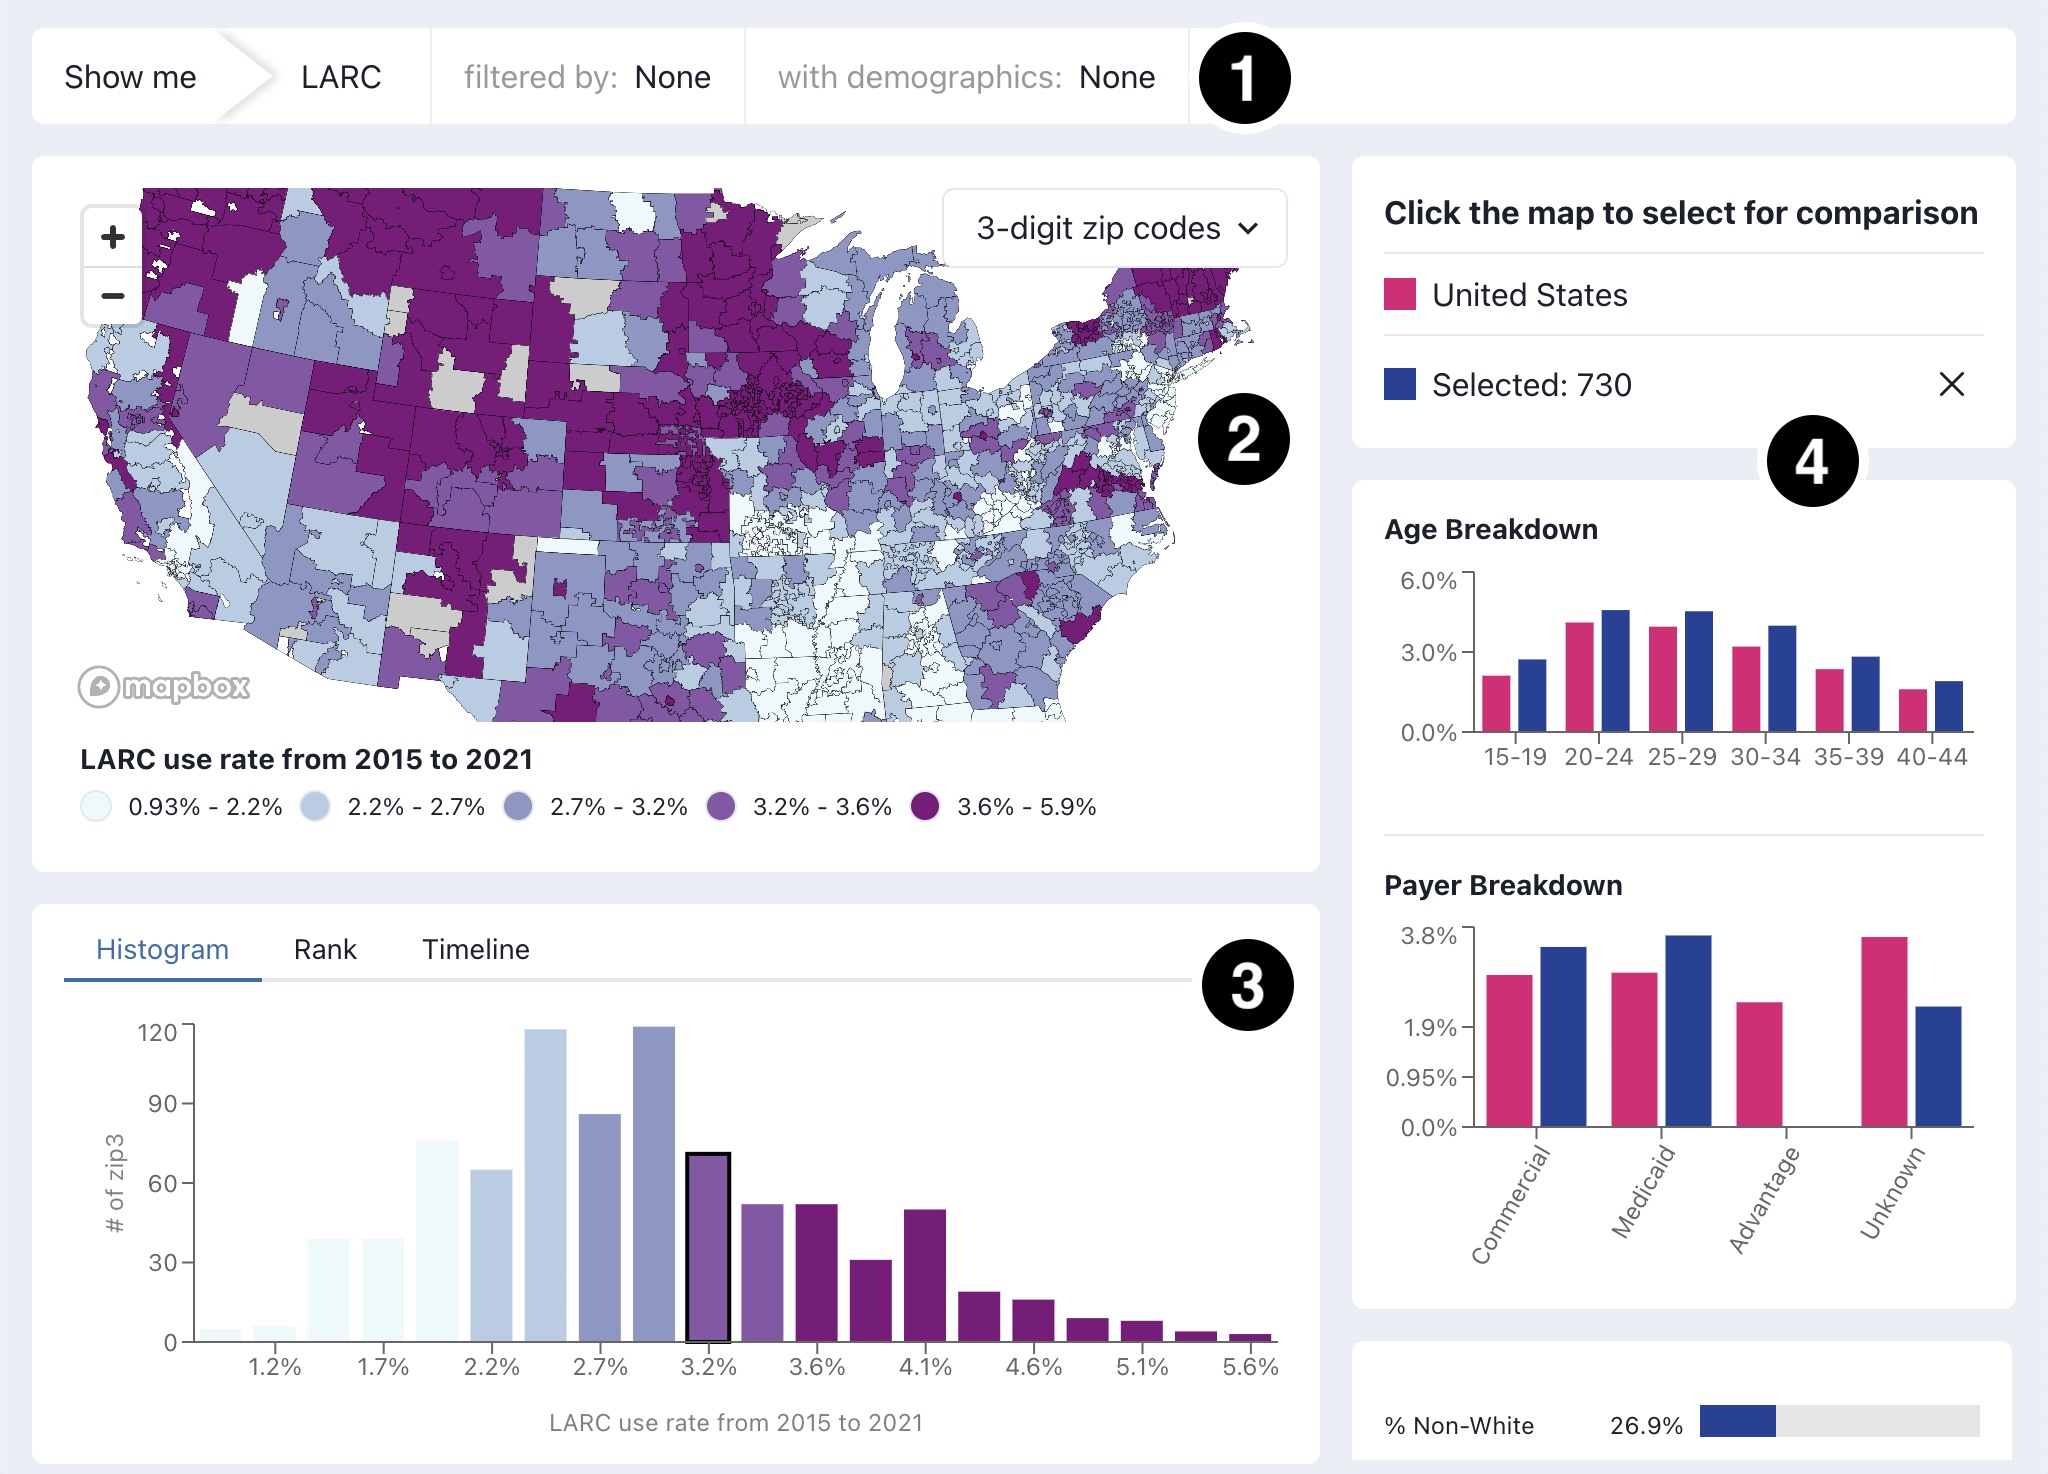
There are four basic parts of the map and data dashboard:
- Show me data filters - First thing to do is select your data of interest from the filter menus across the top.
- Map and legend - Explore the data geographically. Choose from three different map enumeration units. Mouse over the map to inspect the values for specific units.
- Charts linked to the map - Below the map, you can view the mapped data in a histogram or ranked bar chart. Mouse over bins and bars to view the associated geography on the map. In the timeline tab, use the slider to select the time range of interest.
- Supporting charts - On the right side of the map, view Payer and Demographic details for a selected map unit or compare across multiple units.
 View the data dashboard